
Infographics
At Well Communications Group, we pride ourselves on being walking oxymorons. (The very best kind of morons…) We’re left AND right brained. Creative AND analytical. We love design… AND math. That’s what makes us so great at infographics. And charts. And lists.
We’re just nerdy enough to love making data pretty.
We’re just nerdy enough to love making data pretty.
Here are some examples of our nerd side:
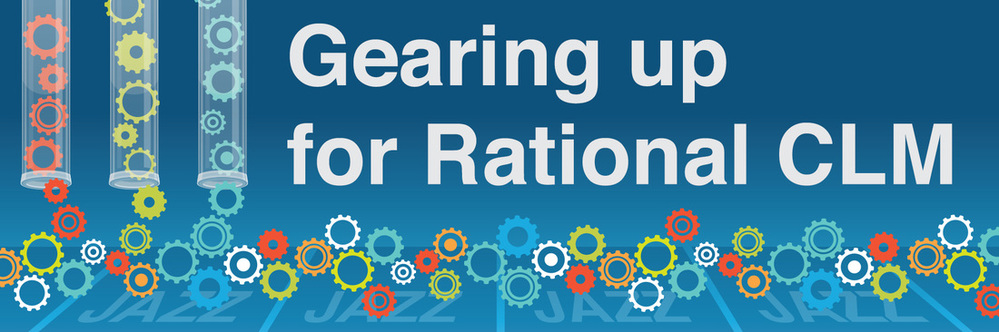
LEA Consulting Group
LEA Consulting Group works with many clients, advising them on large-scale procedure change. They needed help generating excitement as they encourage the IRS to adopt a new software processing tool, IBM Rational. The graphic we designed illustrates the different programs within the Rational suite, and how they function together to create an efficient platform for many departments.
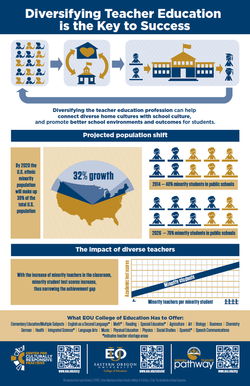
Eastern Oregon University
The College of Business and Education needed an infographic highlighting the need for minority teachers in public schools. They sent us the data, and we created a set of images that reveal the need at a glance.
|
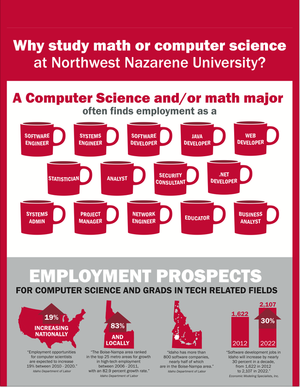
NNU Computer Science
Northwest Nazarene University is recruiting engineers and computer science geeks. We presented the detailed information in a lighthearted manner, easy for 17-year-old prospects (and their parents) to digest.
|
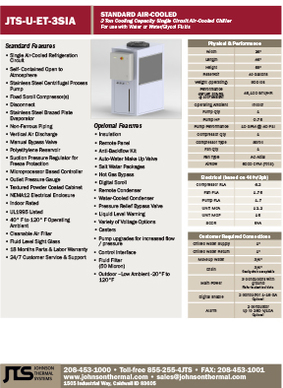
Johnson Thermal cut sheets
Johnson Thermal Systems was rolling out an entire line of chiller products, each with specific capacities, sizes and features. We organized the information and created a catalog of detailed "one-sheets" - presenting highly informational data in an organized and pleasant system.
|